April 25, 2017
How to Use the Burndown Chart Tool with Agile Teams
Being a member of agile team, you would hear the term ‘Burndown Chart’ frequently. Driven by curiosity, you might have glanced at the burndown chart but you thought it was too simple to understand. Do you wonder how people use such a simple tool to track the progress of their sprint?
Do not worry! In this article, we will start from the fundamentals of a burndown chart. We will understand how to create effort burndown chart and interpret the results. Lastly, we will share a few tips to assure that you use the burndown chart tool with agile team effectively.
What is a burndown chart?
Burndown chart is a fundamental metrics of agile software development process. It is a simple, yet powerful chart that can be used on a daily basis for tracking the project progress. A burndown chart is a representation of effort remaining over a period of time. The graph has the following details:
- X- axis is the number of days for the sprint
- Y- axis is the effort remaining for the sprint
International Software Testing Quality Board, ISTQB, defines burndown chart for an agile process as:
A publicly displayed chart that depicts the outstanding effort versus time in an iteration. It shows the status and trend of completing the tasks of the iteration. The X-axis typically represents days in the sprint, while the Y-axis is the remaining effort (usually either in ideal engineering hours or story points).
How to Create a Burndown Chart?
Project management tools allows you to create tasks or story points in a sprint and plan an estimated effort for each task. These tools also give you the flexibility to update the progress of each task as you work on it. Good software project management tools give you the visualization of your project progress through burndown chart. All you need is to update the statuses on tasks and the tool will create burndown chart for you.
However, there are numerous teams who do not use expensive tools. We will guide you how to create a burndown chart even if you are maintaining simple excel file to keep a track of your progress.
Effort burndown chart is based on the agile principle of working at a consistent pace. For example, a sprint requires 80 hours of effort and the sprint needs to be completed in 10 days,the team will work an average of 10 hours per day.
Let’s follow the step by step process to create effort burndown chart for your release.
Step 1 – Estimate Effort of your Tasks
Create two columns in your excel workbook with headers ‘Tasks/Story Point’ and ‘Estimated Effort’. In the tasks column, list down your task ids. In the estimated effort column, enter estimated effort for each task in terms of hours.
Step 2 – Plan Number of Days for Sprint
You can now plan the number of days available to release the sprint. Let’s say, you set 10 days for your sprint. Add 10 columns to your table with headers Day 1, Day 2…. Day 10. You can also plan in terms of ‘date’ instead of days.
Step 3 – Calculate Total Estimated Effort
Now, you can calculate the total estimated effort for the sprint by summing up the column of ‘Estimated Effort’. At this point in time, you can also decide an effort level to be exerted per day to ensure a consistent workload throughout the sprint. In our example, it is assumed that team will work 8 hours each day.
Step 4 – Calculate Remaining Estimated Effort
This is the ideal effort that will remain at a given day, if team follows the sprint plan. To calculate remaining estimated effort, subtract the sum of estimated efforts from total estimated effort.
For example, total estimated effort is 80 hours. You want to calculate the ‘Remaining Estimated Effort’ at day 3. You will sum up the estimated efforts of day 1, day 2 and day 3 i.e. 8 *3 =24. Then, subtract this from total estimated effort i.e. 80-24= 56. Hence, the remaining estimated effort at day 3 is 56 hours.
Step 5 – Enter Actual Effort
As days pass, enter team’s actual effort for each task in the respective day’s column.
Step 6 – Calculate Remaining Actual Effort
Your actual remaining effort can vary as you start progress on a task. You might also need to re-estimate the actual effort required to complete the task. For example, initially you had estimated 10 hours for a task. After working 8 hours on day 1, you should have effort remaining of only 2 hours. On the contrary, you realize that the task needs 4 hours, not 2, to get completed. Hence, you enter 4 hours as remaining actual effort for that task.
Step 7 – Insert Chart
Now you have all data for your sprint burndown chart. It is time to insert a chart and see the graphical illustration of the project progress.
- Select the rows of ‘Estimated Remaining Effort’ and ‘Actual Remaining Effort’.
- Go to Insert tab -> Line chart -> Line with Markers.
Editing the burndown chart.
You might need to customize the chart a bit. We did the following changes:
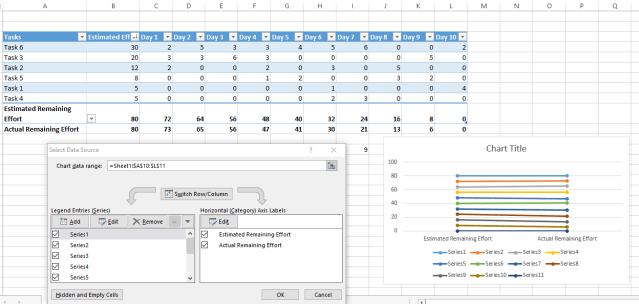
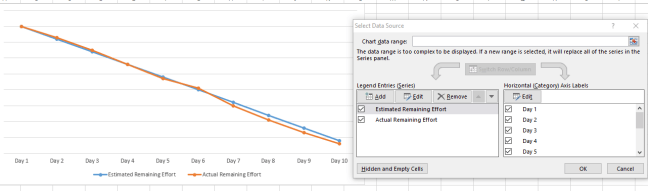
- Right click on the chart -> Select Data
- Click ‘Switch Row/Column’
- Put ‘Estimated Remaining Effort’ and ‘Estimated Actual Effort’ in the ‘Legend Entries’
- The ‘Horizontal Axis Labels’ are set to ‘Days’
- Click on the ‘Hidden and Empty Cells’ button-> Select ‘Connect data points with line’
An example of a burndown chart.
Useful Information in your Effort Burndown Chart
Read the definition of burndown chart again and you can get the following important information from the release burndown chart.
Total Estimated Effort and Working Days
At the time of planning the sprint, developers and the quality assurance team give estimates of effort required for each task or story point. The estimated versus actual effort is tracked using burndown chart.
A burndown chart graphically represents the total effort required to complete a sprint in term of hours, if you read along y-axis. You can also see the number of days required for the estimated effort by reading along x-axis.
Amount of Work Remaining or Effort Remaining
The burndown chart tells you the effort your team has burnt down till a specific time. You can know the amount of work remaining in any sprint by plotting the story points against y-axis. In other scenario, you might prefer to log the effort in terms of hours against y-axis to get a quick overview of remaining effort from burndown chart.
Ideal Effort
The ideal effort is the straight line drawn from the top of y-axis to the end of x-axis. It visualises the expected ideal effort which serves as a guide to the team. You can monitor and control your progress on the basis of whether your actual effort goes up, down or in alignment with the ideal effort.
Actual Effort
Generally, your actual effort varies from the ideal effort. As your team works on the tasks and updates the progress of task, they actually burn some effort down in the chart. The actual effort can also be seen on the burndown chart. If more items are added in the sprint, after it has started, a spike will occur in the actual effort.
Reading the Effort Burndown Chart Correctly
As a manager, it is primarily important to be able to interpret the results effectively and take required action. Reading effort burndown chart is simple. Your burndown chart will fall into one of the following categories:
Ideal Scenario – Working Exactly as Expected
Ideal scenarios are hard to occur in real world. An ideal scenario would have the actual remaining effort meeting all points of estimated remaining effort. This means that team is exerting the same number of effort hours, as planned, and will meet the sprint target in time.
Remember, if your team’s burn down chart falls in this category, take serious action to verify that the team is representing correct information
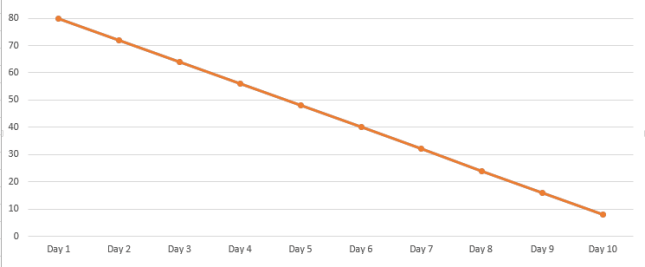
An ideal burndown scenario.
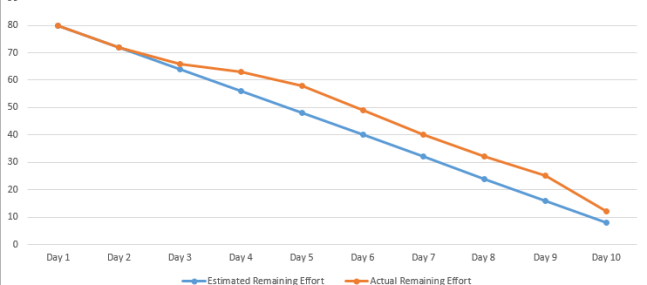
Good Scenario – Meeting Commitments
This scenario resembles with our previous example. A good scenario is one where your team is varying only a little from your sprint plan. They might put a little less effort one day, a little more on the other day and sometimes, they will put exactly the same effort as planned. If your team is meeting the commitments with a slight difference in time, it is most likely that they will achieve the target in time – working at a consistent pace of effort.
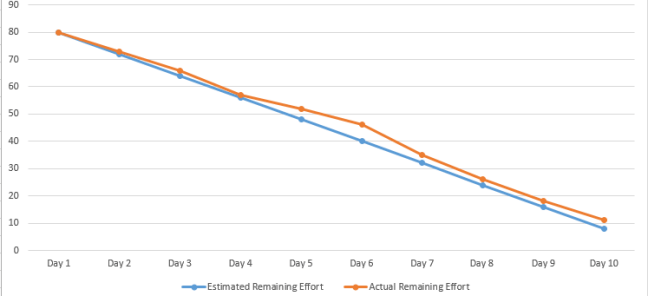
A good burndown scenario.
Undesirable Scenario – Alarming Situation
Forget the workload, imagine your team is not meeting commitments and is unlikely to deliver the sprint on time. This is a bad scenario and an alarming situation. This situation can be easily identified in graph as the actual remaining efforts continuously stay much above the estimated remaining efforts line. In such a situation, you might need to force your team to put more efforts in the remaining days of the sprint than planned.
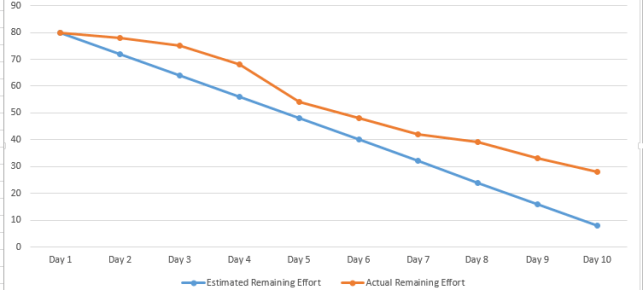
An alarming burndown progress situation.
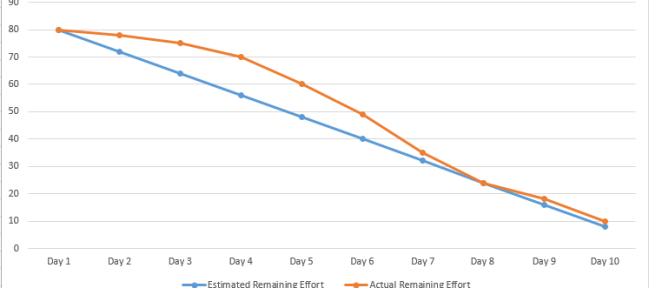
Undesirable Scenario – Incorrect Estimates
Let’s not talk about the lazy or careless teams. Let’s talk about your dedicated team members who have started working on the sprint items since day 1. Initially, they worked the same number of hours as per plan. Gradually, they realize that they need to invest more effort to get the tasks done.
Now you might be thinking what landed your hardworking team into this situation. The answer is ‘Incorrect Estimates’. If you need to put more actual effort than estimated, for almost all of your tasks; you need to rectify your estimation techniques.
An example of incorrect estimates of burndown progress.
Bad Scenario – Not Meeting Commitments
It happens in many teams that the team does not start well in time. They might not be putting the required effort in the beginning. Later, in the middle of sprint they start working zealously and put more than planned effort each day. In the end, they are left with a little workload for the remaining days of the sprint. The team delivers the sprint and meets the target.
There is no doubt that delivery of release is primarily important as a result. However, a good manager will ensure a uniform workload on the resources so that they don’t burn out of exhaustion. If your effort burn down is similar to the below chart, you need to hold retrospective sessions and make sure that same mistakes do not occur in the next sprint.
A bad burndown scenario.
Avoid Common Mistakes while using Effort Burndown Chart
Although effort burndown charts are simple, yet there can be a few common mistakes that you might make while working with it. We are listing down a few tips and techniques that can help you avoid common mistakes.
Do not confuse ‘Actual Remaining Effort’ with ‘Actual Spent Effort’
New team members need to be educated on this particular point. Generally, we enter actual effort spent in our timesheets. Hence, it is likely that new members don’t pay much attention to the column header and enter actual effort spent on the task, rather than actual remaining efforts.
Do not estimate a Big Task
The essence of agile is to work in smaller chunks. If there comes a big feature in your sprint, break it down to sub tasks and estimate at smaller level. This increases the chances that your team estimates the required effort correctly.
Estimate Actual Remaining Effort honestly
Every day when you enter actual remaining effort, don’t force your estimate to match with your initial estimates. It happens a lot of times, when you start working on a task new things come up and you get a clearer picture of remaining effort required. Enter the actual remaining effort honestly in your chart so that the team performance can be monitored and controlled effectively.
Conclusion
Till now, we have understood the purpose and importance of a burndown chart. We also discussed the important pieces of information that can be extracted from a burndown chart. In the later section, we developed the ability to interpret the effort burndown chart of a sprint. Briefly, we also touched a few important tips and techniques to avoid common mistakes while working with burndown chart tool.
This article covers all aspects of using burndown chart tools in agile teams. Do share your thoughts and queries about burn down charts in the comment section.
Share article