December 21, 2016
Agile Testing Metrics to Measure the Performance of Software Testing Process
It is often said that if something cannot be measured, it cannot be improved. This is why you need a standard or a benchmark against which you can measure your performance. Hence, it is necessary to define some agile testing metrics for your agile projects that suit your needs.
While managing your projects in agile, you might often wonder if your performance is up to the mark. You might also be looking for a manner to improve your process and set new targets for yourself.
In this article, we will focus on the test metrics and discuss agile testing metrics in detail. Agile testing metrics are the benchmark for measuring the performance of the software testing process in your agile environment.
Software Testing Metrics
Software testing metrics are the means through which one can measure the quality of software. These test metrics can be quantitative and qualitative in nature. Software testing metrics gives insight about the efficiency and effectiveness of your software testing process.
As a QA manager, you are required to make a wise decision when it comes to selecting the agile testing metrics for your project or company. There are several software testing metrics which measure different aspects of the software testing process and the performance of quality assurance teams.
Qualities of Software Testing Metrics
As a recommended practice, your kit of agile testing metrics should be a mix to measure various attributes of your product and quality assurance process.
Keep in mind the following key qualities when selecting your agile testing metrics:
1. Gives Insight of the Business Value
There should be at least one software testing metrics that you can present to the senior management and they can comprehend the return value provided by that metrics. In another case, senior management might think that the amount of time and effort invested in the agile testing metrics is not beneficial to the overall business.
2. Measure Effectiveness
Select one or more metrics to give you information about the effectiveness of your software testing process. Defect detection percentage is one such agile testing metrics.
3. Measure Efficiency
Your software quality assurance process might be effective, yet there can be room for improvement in terms of efficiency. Defect category, mean time to detect defects and mean time to repair are examples of such testing metrics.
4. Cost Related
As a general practice, your set of metrics should also have a cost related test metrics.
Agile Testing Metrics
Burndown Charts
Burndown charts are simple graphs used to track the progress of the project. These charts are used in the agile projects where teams divide their work and deliver the product in the form of sprints.
At the beginning of the sprint, the team plans the work required in the sprint and predict its timeline. Sprint burndown charts are used to track the progress of the sprint i.e. whether it is meeting the planned timeline or not.
Burn down charts shows the rate at which features are completed or burned down at release and iteration level. It provides visualization of the amount of the work that is yet to be completed. The burndown chart is used to predict the remaining time required to complete the sprint.
Burndown charts give you a clear insight if things are not going according to plan by giving you information about the following:
- Remaining work
- Work completed
- Work completed in each iteration/sprint
- The difference between planned and actual performance in terms of time.
A burndown chart can be easily created using any spreadsheet i.e. excel or google documents. To create a burndown chart, note down your planned dates, the estimates planned effort and the actual effort exerted to complete the work. The x-axis represents time and the y-axis refers to the amount of remaining effort.
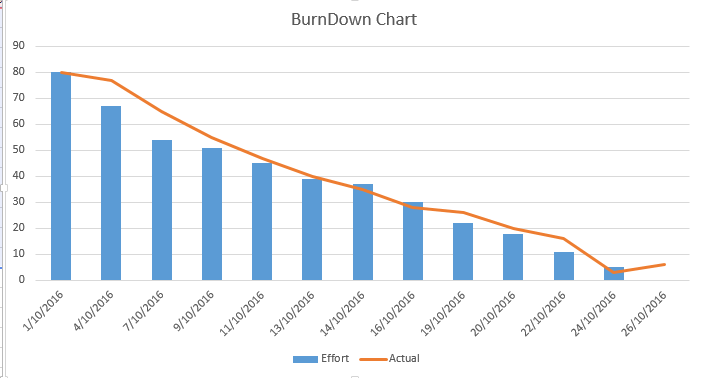
In the beginning of the sprint, all effort is yet to be put in that is why it is maximum at the start. By the time, the sprint comes near to its completion the remaining effort required decreases till it becomes zero at the end.
If the actual line is above the effort line, it means we have put more than the estimated effort in a task. If actual line below the effort line, it means we have completed the task by putting in the lesser effort. If actual line and effort line meet each other, it means we are going as per planning.
If there is much difference between actual and effort line, it might happen because you have not given realistic estimates. If you have given realistic estimates and still your actual line is mostly above the effort line, it might happen because your QA team is not performing efficiently. As a good QA manager, your planning should be accurate enough and your actual and effort line should meet in the burndown chart.
Percent of Test Case Execution
The ‘Percent of Test Case Execution’ metrics is indicative of the testing progress in the iteration or sprint. An executed test case may result in a pass, fail or blocked/cannot test status.
Percent of Test Case Execution = {(Number of Passed Test Cases + Number of Failed Test Cases + Number of Blocked Test Cases)/Total Number of Test Cases} *100
This metrics provides a summary of test execution activities. It gives you an insight into the productivity of QA team and the progress of testing activities. Note that some test cases need more time to execute so you cannot judge the efficiency of a QA based on this metrics alone.
Percent of test case metrics should have a value of 100% at the time of completion of software deliverable. If it is not 100%, the team needs to review the unexecuted test cases and make sure that no valid test case is left from execution.
The percent of test case execution does not mean that your targeted QA tasks have been completed successfully. It is possible that you achieve 100% of test case execution, yet there is a lot of QA work remaining. This is because QA team might have executed all test cases, but there can be a lot of failed and blocked test cases that need to be retested unless passed. A more useful metrics is the ‘Percent of Passed Test Cases’ which we will discuss next.
Test Case Pass Rate
The test case pass rate indicates the quality of solution based on the percentage of passed test cases. It gives you a clear picture of the quality of the product being tested. Test case pass rate can be calculated by dividing the number of passed test cases with the total number of executed test cases.
Test Case Pass Rate = Number of Passed Test Cases/Total Number of Executed Test Cases
The value of this metrics should increase as the project progress. In case, test case pass rate does not increase in the later stages, it means that due to some reasons the QA team is unable to close the bugs. If test case passes rate decrease, it means that the QA team has to re-open the bugs which are even more alarming.
In both cases, the QA manager needs to collaborate with the development team and need to investigate the causes. It is also possible that the developers are unable to comprehend the reported as they might be ambiguous or poorly reported, not hitting the root cause but symptoms.
Defect Category
Defect category metrics can be used to provide insight about the different quality attributes of the product. The categories may include functionality, usability, performance, security, compatibility.
Defect Category = (Defects in Category X/Total Number of defects in the Product)
If you intend to use these metrics in your agile project, you need to assign a category to each bug or defect while reporting bugs. This metrics can be used by QA manager to plan a strategy focused on a specific quality attribute.
If there are more bugs in one category, the QA manager will give special attention to that category in the next iteration or sprint. For example, if there are more functional issues, the QA manager might propose the suggestion to improve the quality and clarity of software requirements specification document.
Similarly, the QA manager might dedicate more time and experienced resources on testing the particular quality attribute.
Defect Density
Defect density is the number of defects found in the software product per size of the code. Defect Density’ metrics is different from the ‘Count of Defects’ metrics as the latter does not provide management information.
Defect density metric not only indicates the quality of the product being developed, but it can also be used as a basis for estimating a number of defects in the next iteration or sprint. It can be defined as the number of defects per 1,000 lines of code or function points.
Defect Density = Total Number of defects/Total lines of code
Defect density has its own pros and cons. A QA manager needs to thoroughly understand these metrics before using it as a benchmark. It is recommended to use a tool to calculate the defect density else it might become labour intensive.
It is useful in comparing similar projects. However, this metric can be misleading if the complexity of the code is not considered, as different parts of the code have a different degree of complexity.
An overall reduction in the defect density indicates a better quality of the product being developed, i.e. there are fewer bugs in the product under test.
Defect Detection Percentage (DDP)
Defect detection percentage is another important agile testing metrics to determine the quality of your testing process. DDP measures the overall quality of your company’s testing process. It is the ratio of a number of defects identified during testing divided by total defects identified in that phase.
DDP = (Number of Defects detected in a Phase / Total Number of defects in that Phase) x 100
Note that the total number of defects in that phase include the customer reported issues and bugs too.
A greater defect detection percentage indicates a reliable and effective testing process.
Mean Time to Detect (MTTD) and Mean Time to Repair (MTTR)
As the name implies, ‘Mean Time to Detect’ refers to the average amount of time taken by QA professionals to detect a bug.
MTTD = Number of issues detected/Total execution time
To calculate the mean time to defect, you need the following data:
- Total number of defects and issues
- The time period during which the system was tested. Note that you don’t need the exact date or time for calculating MTTD.
This is an important metrics that does not only tell you the productivity of your QA team; rather, it also tells the effectiveness of your test cases. As a good QA manager, you would desire to detect more bugs and issues with a lesser number of test cases and in minimum time.
Similarly, ‘Mean Time to Repair’ is the average amount of time taken to fix the issue. This metrics is related to the efficiency of the development team.
MTTR = Number of issues fixed/Total coding team
Recap
In this article, we looked at the various agile testing metrics. Each testing metrics is used to measure a specific quantitative or qualitative attribute of the software product. It is the responsibility of the QA manager to meticulously select the agile testing metrics that provide the best insight and maximum return of value to the business. Testing metrics need to understood and analysed carefully as there can be several misleading factors associated with agile testing metrics.
You can select several agile testing metrics to give you visibility of different process management areas such as burndown charts, percent of executed test cases, percent of passed test cases, defect category, defect detection percentage, mean time to defect and mean time to repair. On the basis of these metrics, you can pinpoint the trouble areas in the effectiveness of your software testing process and devise a strategy to improvise accordingly.
We wish you the best of luck in measuring and improving your software quality assurance process. Which agile testing metrics do you use for measuring the performance of your software testing metrics?
Share article