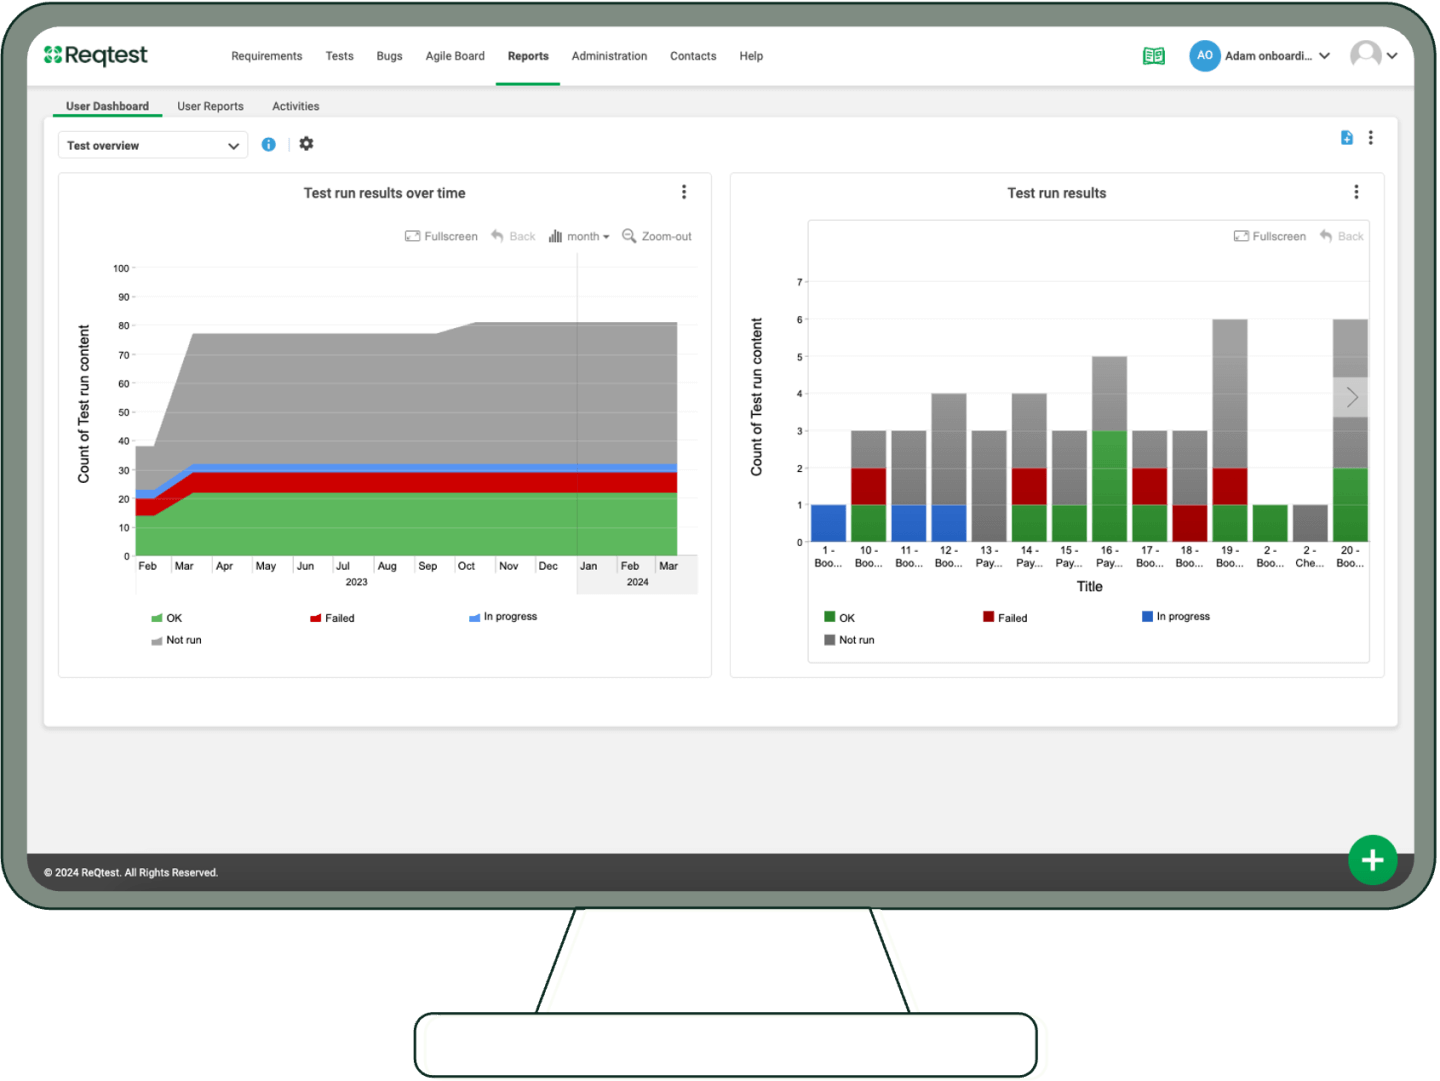
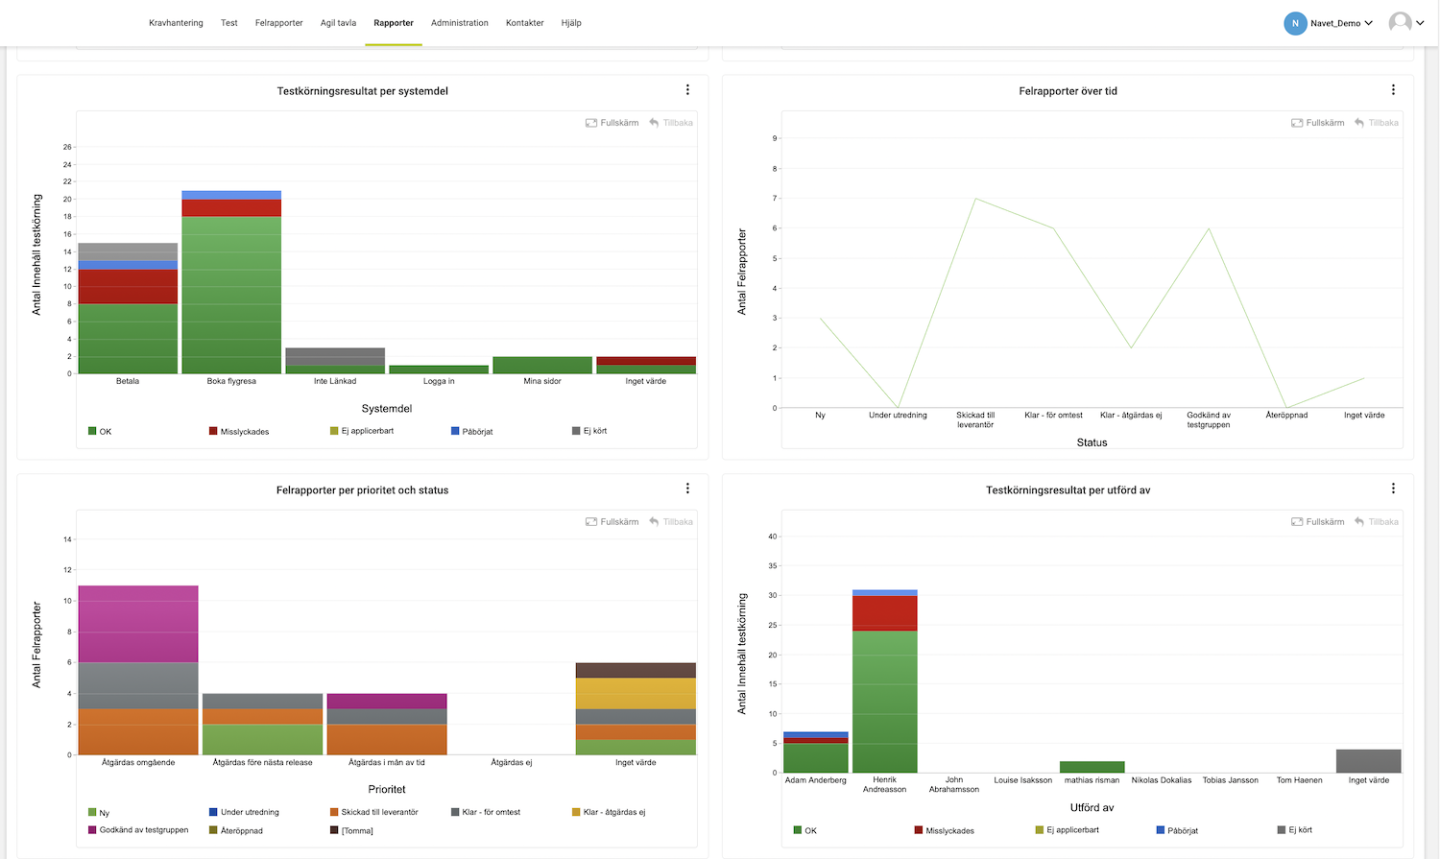
Get valuable insights with customizable reports
Build custom graphs, create your own dashboard, and share insights with your team. With Reqtest’s reporting feature it’s easy to stay on track in your project.
- Create and customize reports
- Visualize data in graphs
- Share with your team
- Save dashboards for easy access
4.5/5 – Capterra
“We utilized the data in Reqtest during our weekly steering group meetings. It allowed us to track and check off milestones and desired quality. Not having to update the progress in Excel provided significant time savings.”
Erik Karlström
Business Owner ERP & Integration, Elvenite
How it works
1. Create reports
Create customized reports by choosing the data you want to analyze. For example, you can measure bug reports, test runs, or the percentage of fulfilled requirements.
2. Build dashboards
Gather your customized reports in dashboards in order to get instant access to real-time project data.
3. Share insights
Share the data directly within the tool or export it to present in, for example, weekly status meetings. With up-to-date and accurate data, it becomes easier to make informed decisions on how to prioritize your resources.
Try Reqtest Yourself
Fill out the form to test Reqtest for 10 days. You’ll be sent an email with instructions on how to activate your account.
-
Structure your tests, requirements and bugs
-
Delegate tasks and collaborate with suppliers or project members
-
Follow the progress and get approval before Go-Live


